
Balance &
Neuropathy.
Balance Impairment in Diabetic Peripheral Neuropathy
How does diabetic peripheral neuropathy relate to standing balance when vision is reduced or information from the support surface becomes less reliable? Using NHANES data, this study examined balance performance across four sensory conditions in adults with different diabetes and neuropathy profiles.
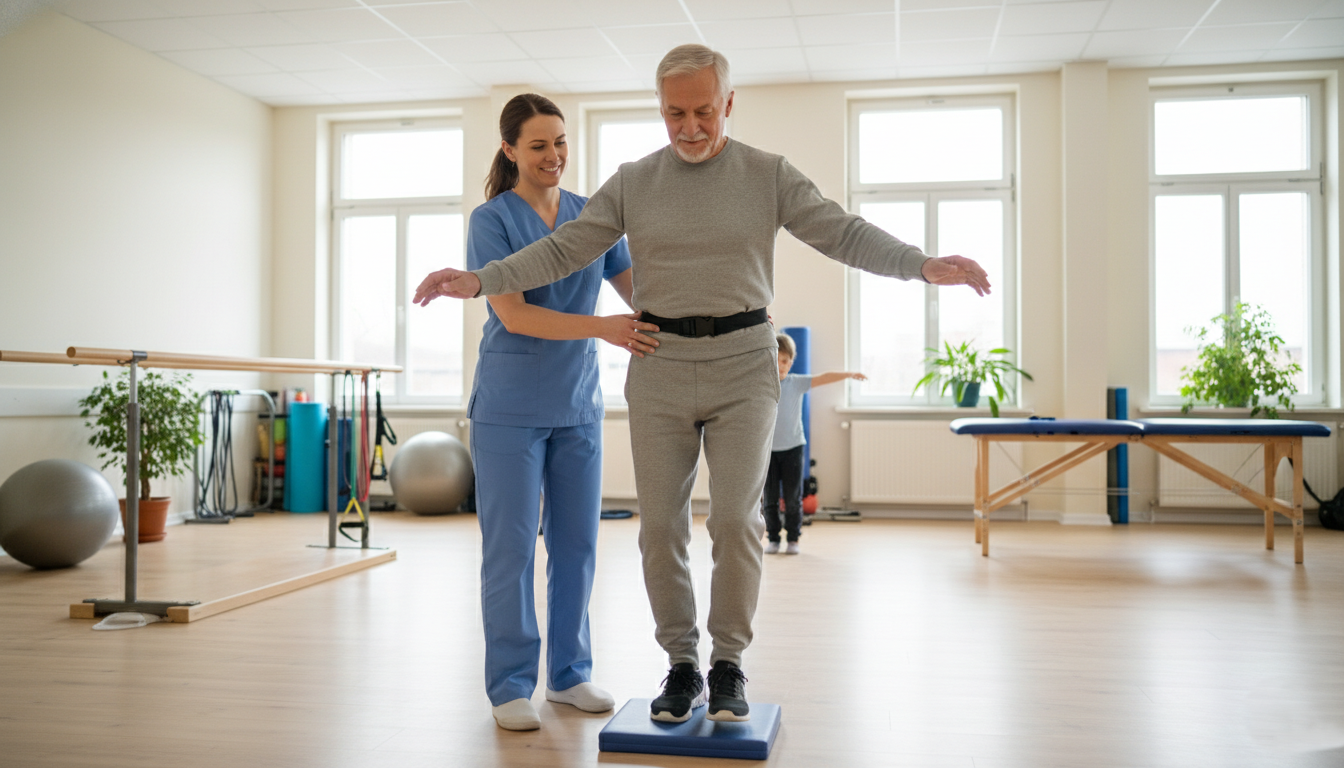
Balance depends on more than standing still.
Maintaining an upright posture requires the integration of visual, vestibular and somatosensory information. Peripheral neuropathy can reduce sensory feedback from the feet, potentially making balance more difficult when other information is limited or less reliable.
What happens when the task becomes harder?
A person may maintain balance when standing with eyes open on a firm surface, yet have greater difficulty when vision is removed or the support surface becomes unstable.
This study compared four standing-balance conditions to examine whether differences between adults with and without diabetic peripheral neuropathy became more apparent as sensory demands changed.
Eyes open
Firm surface
Vision and reliable support-surface information are available.
Eyes closed
Firm surface
Visual information is removed while the support surface remains firm.
Eyes open
Compliant surface
Vision remains available, but support-surface information becomes less reliable.
Eyes closed
Compliant surface
Both visual information and reliable support-surface cues are limited.
From population data to adjusted comparisons.
The analysis used the 2003–2004 NHANES cycle, combining peripheral-sensation classification with standing-balance assessments and survey-weighted statistical modeling.
A cross-sectional analysis of nationally representative data.
The analytic sample included adults aged 40 years or older with valid balance-assessment data. The study compared participants with diabetic peripheral neuropathy, diabetes without DPN, prediabetes without peripheral neuropathy, and healthy controls.
The analysis accounted for the NHANES complex survey design and adjusted for demographic and socioeconomic factors and body mass index.
Literature review, data cleaning, group classification, survey-weighted logistic regression and research-paper writing.
Data source & participant selection
Used NHANES 2003–2004 data and retained 2,152 adults aged 40 years or older who met the study's eligibility criteria and had valid balance-assessment data.
Peripheral sensation classification
Used a 5.07 Semmes–Weinstein monofilament delivering approximately 10 g of force at the plantar first metatarsal head, fifth metatarsal head and hallux on each foot. At least one insensate site on either foot met the study's peripheral-neuropathy criterion.
Modified Romberg balance assessment
Compared pass/fail performance across four conditions that varied vision and the reliability of the support surface. Conditions 1 and 2 lasted 15 seconds; Conditions 3 and 4 lasted 30 seconds.
Survey-weighted logistic regression
Used Stata 18 to estimate adjusted odds ratios and 95% confidence intervals. Models adjusted for age, sex, race and ethnicity, education, household income and BMI, with healthy controls without peripheral neuropathy as the reference group.
Four groups. One common assessment.
Participants were classified by diabetes status and peripheral neuropathy. Comparing these groups helped distinguish the observed association with DPN from diabetes status alone.
Diabetes with peripheral neuropathy
4.7% of the survey-weighted population
Diabetes without DPN
11.1% of the survey-weighted population
Prediabetes without peripheral neuropathy
14.8% of the survey-weighted population
Healthy controls without peripheral neuropathy
69.4% of the survey-weighted population
Note: Counts are unweighted sample sizes (n). Percentages are survey-weighted and reflect the paper's reported population estimates. Percentages may not correspond directly to the raw sample counts.
The differences emerged under sensory challenge.
Compared with healthy controls, participants with DPN had significantly higher adjusted odds of failing all three modeled balance conditions.
Adjusted odds of balance-test failure
Points indicate adjusted odds ratios; horizontal lines indicate 95% confidence intervals. The dashed vertical line marks an odds ratio of 1.
An adjusted odds ratio above 1 indicates higher odds of failing the balance condition relative to the reference group. Models accounted for the NHANES complex survey design and adjusted for age, sex, race and ethnicity, education, household income and BMI. Condition 1 was not included in the adjusted model because of insufficient outcome variation.
Eyes closed · firm surface
Participants with DPN had 4.43 times the adjusted odds of test failure compared with healthy controls (95% CI 2.12–9.25).
Eyes open · compliant surface
The largest estimated association was observed when the support surface became less reliable, even with eyes open (95% CI 3.18–34.57).
Eyes closed · compliant surface
Participants with DPN also had higher adjusted odds of failure under this combined challenge (95% CI 1.47–3.45).
What became visible when sensory demands increased?
The pattern suggests that ordinary standing may not fully reveal balance difficulties associated with DPN. More challenging conditions exposed differences that were less apparent when vision and a firm support surface were both available.
Routine standing showed little separation.
Failures were rare with eyes open on a firm surface, and the paper reported no significant group difference (p = .730).
DPN was associated with difficulty across the modeled conditions.
Higher adjusted odds of failure were observed when vision was removed, when support-surface information became less reliable, and when both challenges were combined.
Diabetes without DPN did not show the same significant pattern.
The diabetes-without-DPN group did not differ significantly from healthy controls in the modeled conditions. The prediabetes group showed higher odds of failure in Conditions 2 and 3.
The results suggest an association, not a proven mechanism.
The findings are consistent with the importance of sensory information in postural control. However, sensory weighting and integration were not directly measured, so the study cannot establish the mechanism behind the observed differences.
What the data can — and cannot — tell us.
Interpreting observational research requires attention to measurement, study design and alternative explanations.
Cross-sectional design
The study identifies associations at a given period in time. It cannot establish whether neuropathy caused balance impairment or determine the temporal sequence of the two.
Measurement boundaries
Monofilament testing identifies loss of protective sensation but may not capture the full range or severity of DPN. The Modified Romberg test records task completion rather than directly measuring postural sway or sensory weighting.
Potential confounding
The analysis adjusted for selected demographic and health factors, but residual confounding may remain. Test duration also differed between conditions, which complicates interpretation of differences in failure rates.
Balance Impairment in
Diabetic Peripheral Neuropathy
The full paper presents the study background, participant selection, operational definitions, statistical models, detailed results, discussion and references.
Read the full paper ↗